

The data set used in the following section of the tutorial is a data file from a CT scan of a turbine-fan. A CT scan was to detect cracks or imperfection in the turbine fan. We will investigate the 3D gradients in density using Dicer and point out some of the major features of Dicer. For more about the turbine-fan data set.
Click to DOWNLOAD fan_64_sds.hdf.
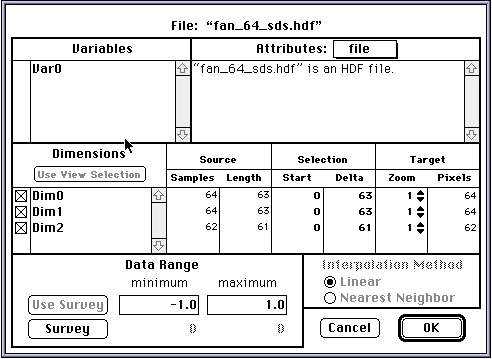
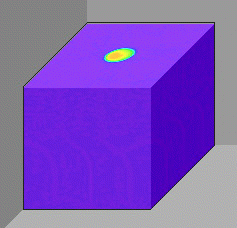
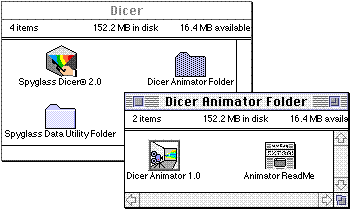
Open the fan_64_sds.hdf file in Spyglass Dicer.
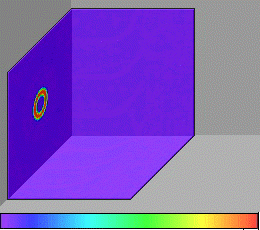
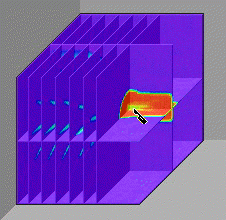
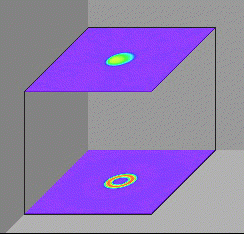
If the first three planes are located up against the two walls and the floor, we see only the shaft on the left most wall.
Additional planes can be drawn in a similar fashion. Typically, as each new plane is chosen, we gain new information which affects how we choose the next plane or to modify the location of previous planes. However, we start to lose information with too many planes. In this instance, the transparency feature is helpful.
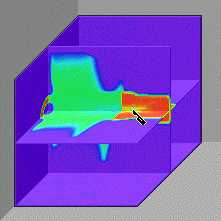
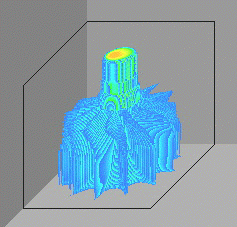
Choosing three or more planes gives the viewer sufficient information to interpret, analyze and, perhaps, discover new information. Here we show the location of embedded flaws near the center line "rotation axis" of the turbine shaft. From a fracture mechanics viewpoint, the location and size of these flaws may or may not be significant. Still, we can use this information as input to a finite element computer program where we can complete the analysis.
Dicer possesses many more features which can be learned at this point by trial and error. We will introduce you to just a few more. After this exercise we encourage you to experiment on your own with other data sets.
One of the most useful features is transparency. Information is lost by drawing too many planes. We can select a particular color representing a given numerical value of physical significance. For example, the physically significant quantity removed here was air.
You have probably noticed that the turbine fan blade is not oriented as
originally defined. Interestingly, the HDF file created by the FORTRAN
program m_sds_hdf.f was changed by the order that the data was written to
file fan_64_sds.hdf . However, if we view the data stored in the file
fan_64.bin (which was created by the C program from the same ASCII file
fan_64.ascii) we will observe the data in yet another orientation.
We will also take this opportunity to show you two other ways to load binary data into Dicer. (To load an ascii file into Dicer you must first convert it to binary using Spyglass Data Utility).
Click to DOWNLOAD fan_64.bin or fan_64.ascii.
Start Dicer and open the file fan_64.bin in folder 64.
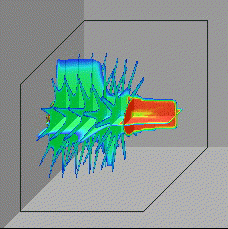
Now lets try something different. Lets fill up the entire volume instead of choosing a few planes.
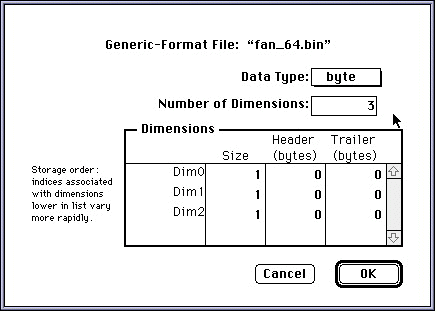
Another convenient way to load binary byte data without choosing the array
dimensions is to append the filefan_64.bin with the array dimensions. That is,
rename the file to fan_64.bin(62x64x64) and information in the filename is used
automatically to load the dimensions of the file the user goes immediately to
the File Parameter table.
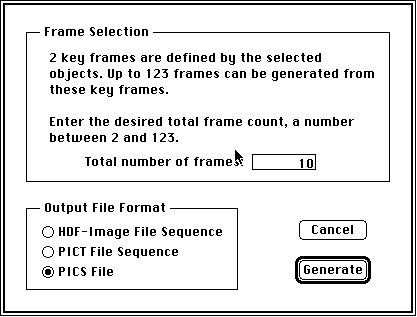
The FINAL Dicer feature we will show you is how to generate and play back an
animation sequence.
When the sequence is completed, the table on the next page appears and requests a filename.
Procedure:
You will now learn how to use Spyglass Transform for the analysis and interpretation
of two-dimensional (2D) data sets. We will introduce you to some of the many
features in Transform. For this introduction we will choose the 30th plane from
the hdf file fan_64_sds.hdf .
Start Tranform:
Typically you would create a rasher-image-set (ris) hdf file for your 2D data
set, but here we chose to show you how to extract a 2D plane form a 3D hdf data
set. You can also load the other binary data sets in the same folder. The newest
version of Transform also allows you to open ASCII data type files. Also
available from NCSA are two public domain software graphic tools, Image 3.0 and
Datascope, which have similar features.
Notice that the highlighted numbers in the table match the rectangular box (see
arrow) in the grayscale image. You can expand the table as large as you CRT can
accommodate. With this tool you can recover your data quantitatively. You can
also generate contour, line graph, wireframe-surface, shaded-surface, and
color-bar. Try each type of graphic tool. This Tile feature is consistent with
Tufte's definition of good graphic practice using "small multiples".
The figure above was generated by choosing 'Line Graph' from 'Image' in the
main menu. Pick a cluster of numbers in the table where there is a small
gradient (continuous change) in density and you will notice that in the
same grayscale region you will not be able to see any gradient. However,
the human eye can not see all 256 shades of gray mapped to the CRT, hence
we need these other tools to reveal significant information.
Next we will contour plot from the same data.
Notice that the same rectangular region appears for comparison with the other
graphs and for comparison we have changed the color table from grayscale to
rainbow. You can label these lines with their numerical equivalent.
Next we can create an interactive wireframe plot. Although this plot at first
appears to be rather course, the trade-off here is for speed of plotting. Once
you find the view point of interest you can increase the resolution as desired by
choosing higher resolution in the lower right box. Below we show only two of the
many choices. The figure below on the left first appears when you hold down the
mouse button and rotates with the movement of the mouse. When you let go of the
mouse button the wire-frame image at the right appears.
For higher resolution we chose the 'Hi-res Framed Color Surface Plot'.
The final figure show the result of choosing the 'Tile' under 'Window' of the main menu.
The main body of the Spyglass tutorial section was taken from
Exersize#6 for ESM5984 class, here at Virginia Tech.
Last revised July 18, 1996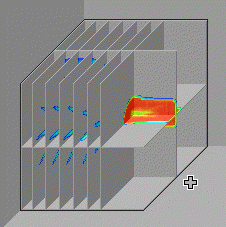

Do not change the Output File Name.
Learning about Transform.
![]()
A table of numbers, shown below, will appear. To expand this table:
![]()
![]()
![]()
![]()
![]()
![]()
![]()

http://www.sv.vt.edu/class/surp/surp96/laughlin/stat/3D_tutor/3D_tutor.html