
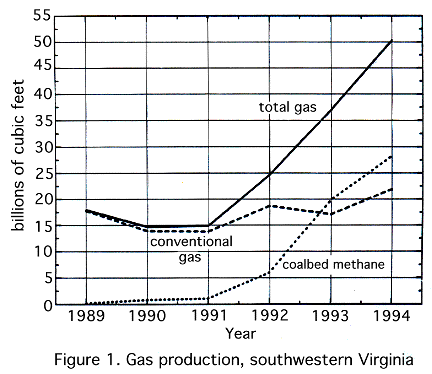
This graph of gas production in southwestern Virginia uses three different lines on the same two-dimensional graph to contrast the coalbed methane production, conventional gas production, and the total gas production over time. Graphing more than one line on a two dimensional graph is an effective method for showing contrast between different types of the same variable. One can easily see that coalbed methane production steadily increased from 1991 and in 1994 produced more cubic feet than conventional gas production, Ref[2].

Last revised July 33, 1996
http://www.sv.vt.edu/class/surp/surp96/laughlin/stat/3D_tutor/second_fig.html