What is a Regression?
Regression is a form of statistical analysis used to
predict a dependent variable (y) from values of an independent variable (x). A regression
equation is derived from a known set of data. The adjacent graph shows the mortality rates
(y) of a group of English men with different smoking habits (x). 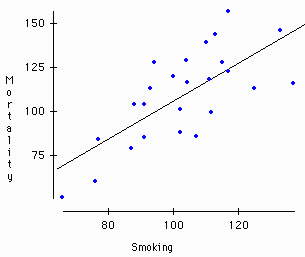 In linear regression, a straight line is drawn
through the data points. The line (y=mx+b) can then be used to predict the mortality rate
of a person with a known smoking habit.
But how was the line drawn?
Many lines could have been drawn through the data in the above figure? How was the plotted line selected? A "residual" is the distance from a data point to a line. If the residual for each data point is determined and squared; a sum of the "squared residuals" could be calculated for each line drawn through the data set!! The regression line is the one line with the smallest sum of the "squared residuals!" It's even got a catchy name, it is call the "Least Squared Regression Line!!"
So…how well does the Regression equation predict an unknown y value based on a known x value?
If all of the data points fell on the line, there would be a perfect correlation (r=1.0) between the x and y data points (Figure 1a and 1b). These cases represent the best scenario for predicting. The positive and negative r value just represents how y varies with x. When r is positive, y increases as x increases. When r is negative, y decreases as x increases.
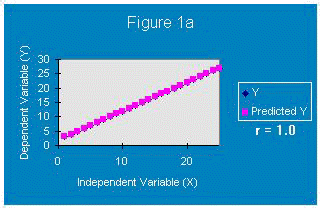
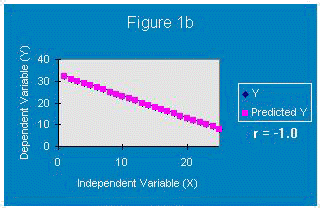
Figure 2a shows a regression line where r = 0.9. It is not a perfect correlation since the data points do not all fall on the line, but many are very close to the line. Since the correlation of x and y data points is close to one, the regression equation will predict unknown y values from know x values pretty well.

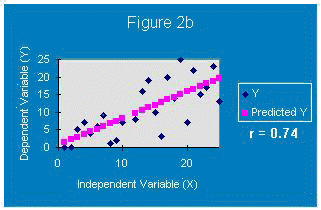
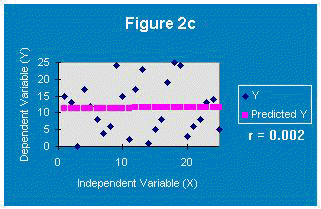
In Figures 2b and 2c, the data points fall farther from the least squares regression line. The correlation between the data points and the regression line drops. Hence, the regression equations will not be able to predict an unknown y value from a known x value as well. If r=0, there is no correlation between the data points and the regression line and it has no predicting value!!
Exploring Regression
In the previous menu, the Diamond and Tokamak activities use linear regression to analyze data sets. The activities assume that you have access to Excel, a TI-83 calculator or another software package capable of performing inferential tests.
Original work on this document was done by Central Virginia Governor's School students Ashley Farmer, Josh Nelson and Sara Throckmorton (Class of '98)
Copyright © 1997 Central Virginia Governor's School for Science and Technology Lynchburg, VA