What is a Correlation?
Correlation is simply a measure of the strength of a relationship between two variables. Correlation measures the linear relationship between the variables; the degree to which their data points fall onto a straight line. The most common correlation measurement is the Pearson product moment coefficient "r " used for parametric data.
The Correlation Coefficient
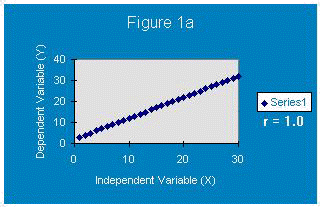
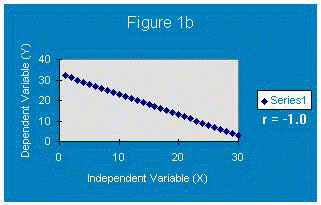
A correlation coefficient "r " reveals two things; the strength of the relationship and the direction of the relationship. If two variables have a perfect correlation (their data points fall onto a straight line), then r =1.0 (Fig 1a) or r = -1.0 (Fig 1b).


The positive and negative values simply show the direction
of the relationship. When two variables are positively related, as one increases, the
other also increases. When they are negatively related, as one increases, the other
decreases. Two variables with less than a perfect correlation will have an "r
value" between 0 and 1.0 or 0 and -1.0. If no relationship exists between two
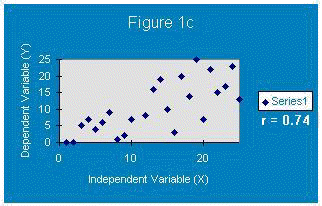
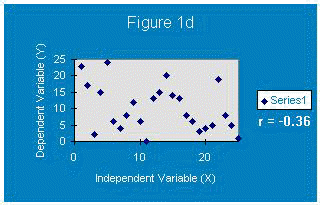
variables, r = 0. Figure 1c shows a data set with a positive correlation coefficient
of
0.74; figure 1d shows a data set with a negative correlation coefficient of -0.36.


In the previous menu, the Birthrate and GPA activities use correlation to analyze data sets. The activities assume that you have access to Excel, a TI-83 calculator or another software package capable of performing inferential tests.
Original work on this document was done by Central Virginia Governor's School students Forrest Frazier, Tony Lassaletta and Lauren McGehee (Class of '98).
Copyright © 1997 Central Virginia Governor's School for Science and Technology Lynchburg, VA