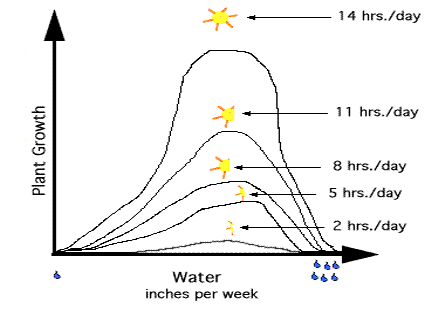
Fig. 3 - How the amount of water affects plant growth with different amounts of sun per day.
This graph illustrates plant growth as a function of inches of rain per week. The independent variable water (in inches per week) is located on the x-axis. The dependent variable, plant growth, is located on the y-axis. Note, there are five two dimensional line graphs plotted in the figure. The five different curves represent the different growth rates when plants were exposed to a specific number of hours of sun per day. One can see that the plants grow best with a medium amount of water and 14 hours of sun per day. Also note that the plant growth increased each time the amount of sunlight increased.
Our common knowledge about plant growth can explain the figure; when plants are under or over watered they do not grow well. This is shown by the bell-shaped curve of the graphs. Plants do not grow well when they are under-watered because they do not have enough nutrients. Over-watered plants do not grow well because excess water in the soil does not allow air into the soil, resulting in the roots not being able to "breathe".
Constructed solely for this tutorial, the above figure does not represent valid agricultural data.
Copyright © 1998 Central Virginia Governor's School for Science and Technology Lynchburg, VA