![]() Guide for performing a
Linear Regression in Excel
Guide for performing a
Linear Regression in Excel
1. Open your data file in Excel.
2. From the Tools menu, choose Data Analysis.
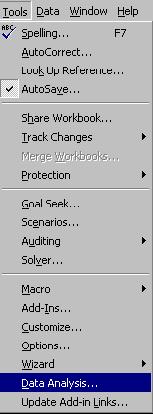
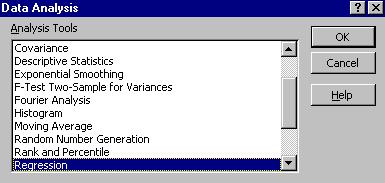
Scroll down until you see Regression; highlight it, then click on OK.
Using the mouse, highlight the cells containing the data for the dependent variable. After they have been selected, click on the box labeled "Input X Range". Using the mouse, highlight the cells containing the data for the independent variable.
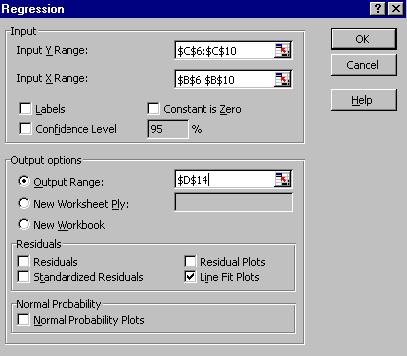
In the section labeled "Output Options", click on the circle beside output range; then click in the box beside it. Using the mouse, select a cell on your worksheet into which you would like the results to be placed. Finally, in the section labeled "Residuals", click on the box beside "Line Fit Plots". Click OK to continue.
The results of the Regression will appear in the designated range.

Original work on this document was done by Central Virginia Governor's School students Stephanie Mayer, Teona Callaham, and Nam Tran (Class of '98).
Copyright © 1997 Central Virginia Governor's School for Science and Technology Lynchburg, VA