![]() Guide for creating a Scatter Plot on the TI-83
Guide for creating a Scatter Plot on the TI-83
1. Put the data for the activity into two lists, one for the independent (L1) and one for the dependent variable (L2).
2. Press 
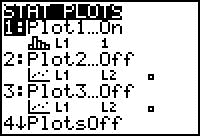
![]() and the STAT PLOT menu will appear. Press the
and the STAT PLOT menu will appear. Press the ![]() key.
key.

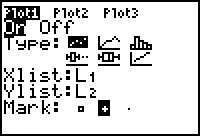
While Plot1 is highlighted in the first row, make
sure that ON is highlighted in the second row. On the third row, select the first graph
choice by pressing ![]() . On row 4, type in the name of the
list using the keys
. On row 4, type in the name of the
list using the keys 
![]() . When
all options are set, press the
. When
all options are set, press the  key.
key.

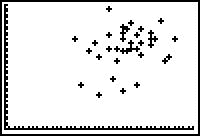
The graph that appears will be a scatter plot of the sample data.

Original work on this document was done by Central Virginia Governor's School student Christian Neeley (Class of '98).
Copyright © 1997 Central Virginia Governor's School for Science and Technology Lynchburg, VA