![]() Guide for creating a Boxplot using the TI-83
Guide for creating a Boxplot using the TI-83
- Put the data for the activity into a list, (L1).
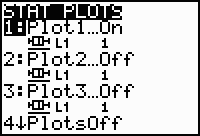
- Press

 to get to the Stat Plot menu.
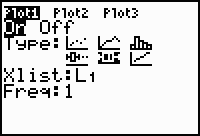
- Turn Plot 1 on and set it up to graph a regular
boxplot of the data in L1.

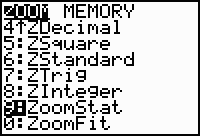
- Press zoom and choose 9: ZoomStat

Original work on this document was done by Central Virginia Governor's School students Jared Edgar and Marie King (Class of '99).
Copyright © 1997 Central Virginia Governor's School for Science and Technology Lynchburg, VA