![]() Guide for making a 3-D Graph using the
Chart Wizard
Guide for making a 3-D Graph using the
Chart Wizard
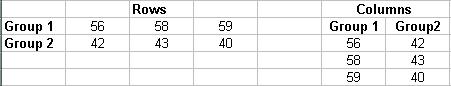
- Arrange data you want to graph in rows or columns:
- Click on the Chart
Wizard,
 .
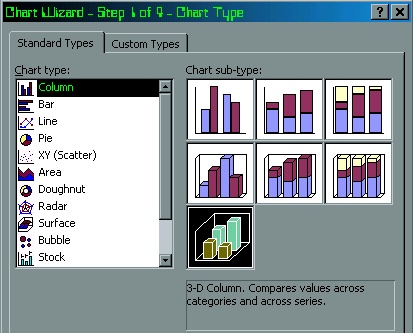
. - Complete the four steps in the Chart Wizard:
Select the Chart type you want (Column or Line), and then the Chart sub-type (3-D Column or 3-D Line).
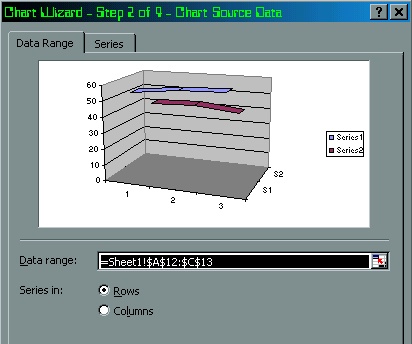
Enter the data range by highlighting the data with the cursor, or by entering the range (A12:C13). Make sure the correct "Series in:" box is checked indicating if the data is in rows or columns.
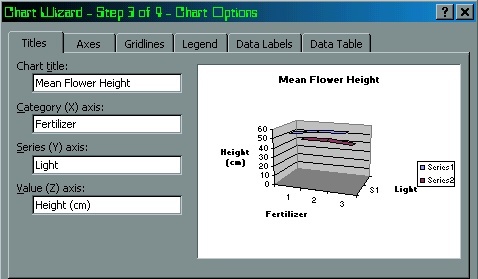
Enter the Chart Title and the titles for the x, y, and z axes.
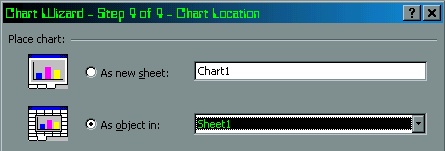
Select the chart location.
Copyright © 1997 Central Virginia Governor's School for Science and Technology Lynchburg, VA