![]() Guide for performing a Two Way Anova in Excel
Guide for performing a Two Way Anova in Excel
1. Open your data file in Excel.
2. From the Tools menu, choose Data Analysis.
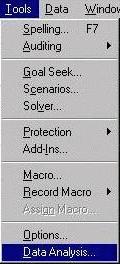
Scroll down until you see Anova: Two Factor With Replication; highlight it, then click on OK.
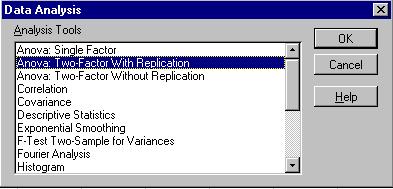
The following dialog box will appear:
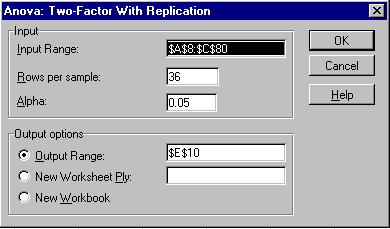
1.Using the mouse, highlight the cells containing the data for all of the samples.
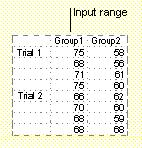
Note that the row and column showing the groups for each factor are highlighted!
2.Enter the number of rows per sample (the number of rows of data in each group.)
3.Enter the desired Alpha level.
4.In the section labeled "Output Options", click on the circle beside output range; then click in the box beside it. Using the mouse, select a cell on your worksheet into which you would like the results to be placed. Click OK to continue.
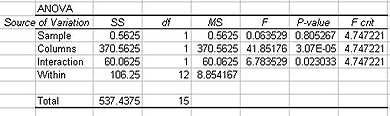
5.The results of the Two Way Anova will appear in the designated range. There is a significant difference between at least one pair of the sample or column means if the F statistic is greater than the F critical value or P is less than the alpha level you have set. Also, comparing the F statistic to the F critical value or the P to the alpha level will indicate if there is a significant interaction term.
Original work on this document was done by Central Virginia Governor's School student Christian Neeley (Class of '98).
Copyright 1997©Central Virginia Governor's School for Science and Technology Lynchburg, VA