 IM
IM 

Fig. 3 - How the amount of water affects plant growth at different amounts of sun per day.
The plant growth as compared to inches per week. The five different curves represent the different growth rates at specific hours of sun per day. One can see that the plants grow best with a medium amount off water, and 14 hours of sun per day. Our common knowledge about plant growth can explain the graph; when plants are under or over watered they do not grow as well, as represented by the bell-shaped curve of the graphs.
Plants do not grow well when over watered since excess water in the soil does not allow air into the soil, which results in the roots not being able to breath.
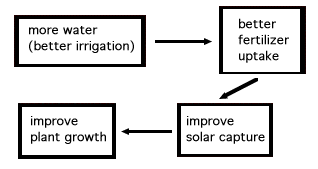
Simply sonstructed for the tutorial, this example does not represent known agricultural principals. The 3D tutorial will continue to use example of plant growth, but please understand that the trends represented are not the results of an experiment. Plant growth as it relates to water, sun and rate of fertilizer application is considered something that is tangible to students in a variety of disciplines. Also note this example does not take into account the synergistic effect (interactive effect) of fertilizer application, water, and sunlight's effect on plant growth. Generally, the more water a plant receives, the better the plant's fertilizer up take is which improves the capture of sunlight, and which causes an increase in plant growth.


Last revised July 26, 1996
http://www.sv.vt.edu/class/surp/surp96/laughlin/stat/3D_tutor/third_fig.html


