Introduction
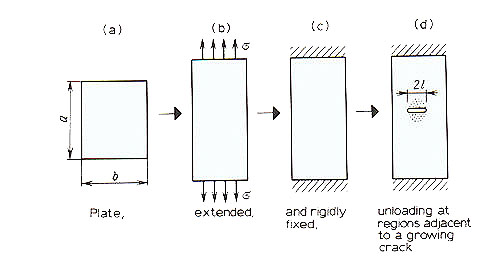
In selecting materials for a given application one must have an idea of the final geometry and the dimension of the part. Under certain environmental conditions and given loadings the part must be able to function properly. One way to make this decision is by comparing the failure criterion to a critical load factor. Fracture is a very complex process that involves the nucleation and growth of micro and macro voids or cracks, mechanisms of dislocations, flip bands, and propagation of microcracks, and the geometry of the material. There has been no one set theory "set in stone" to handle all of these factors in fracture. However there are many proposed theories used to understand the complex nature of fracture in the material. One such class of theories involved energy concepts. In order to understand the complex nature of fracture in materials, one must understand the nature and character of initial cracking. This is only possible if we know the distribution of internal stressed in the body, but also the stress needed to initiate fracture and the length of the crack as shown in Figure 1.
Griffith Theory of Brittle Fracture
One such introductory model was developed by a young English
scientist called AA Griffith. He recognized the macroscopic potential
energy of the system consisting of the internal stored elastic
energy and the external potential energy of the applied loads,
varied with the size of the crack. Therefore fracture is associated
with the consumption of energy.
Once a crack is propagated throughout a material as illustrated
in Figure 1. , the extension of the crack resulted in the creation
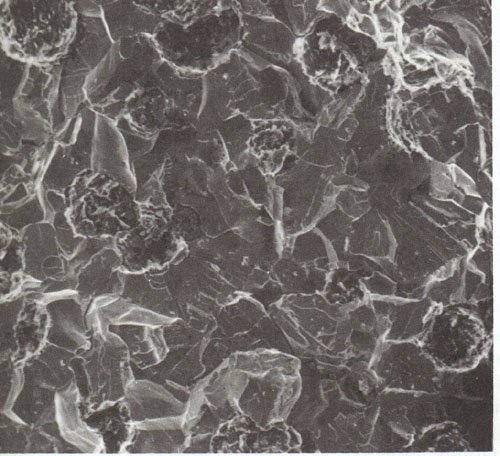
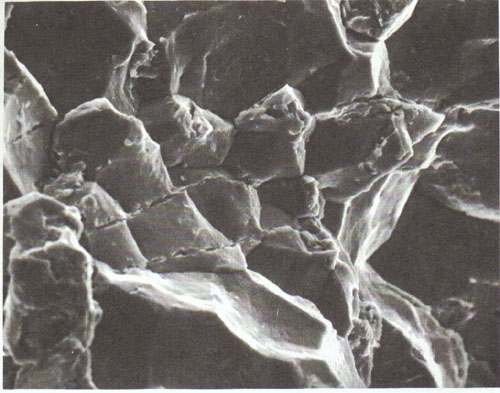
of new crack surface. New free surfaces are created at the faces
of a crack, which increases the surface energy of the system.
Such new surfaces can be seen in Figure 2 and Figure 3.
One such model used to demonstrate the propagation of a crack
in a brittle material is called the elastic strain energy
model.

In today's material world many materials also experience some
plastic deformation during fracture during fracture. Therefore
the crack extension involves more than just an increase in surface
energy. gp represents a plastic deformation energy
associated with crack extension. gs + gp can
be substituted into the above equation to model materials that
undergo some plastic deformation.

Please note that crack propagation can only occurs when it exceeds
the critical value of G.
If the specific surface energy for polmethyl acrylate is 36.5
ergs/ cm2 and its corresponding modulus of elasticity
is 2.38 GPa. Compute the critical stress required for propagation
of an internal crack length is 0.03m.
Solution
(36.5 ergs / cm2)*(1 Joule / 1.0 * 107 ergs)*(100 cm / m)2 = .0365 J / m2
2.38 GPa = 2.38 *109 Pa
sc= (2(2.38*109 Pa)(0.0365 J / m2 ) / ( * (0.03m)/2) ) ^ (1/2)
sc= 60,719 Pa
Griffith - Orowan - Irwin Failure Criteria
The process of fracture consists of crack initiation and crack
propagation. The condition necessary for crack initiation is
if the crack-like cut is able to propagate. If there was a perfectly
elastic body with a slit already present. If the slit is to propagate
thereby increasing its surface, the slit will need a certain amount
of energy. This energy is called the energy of fracture. With
the formation of a new surface the strain in the corresponding
area will be reduced which results in the release of corresponding
elastic energy from the body.

Energy Release Rate
The energy release rate often denoted by G is the amount of energy, per unit length along the crack edge, that is supplied by the elastic energy in the body and by the loading system in creating the new fracture surface area. In terms of the stress intensity factor there is relationship called the Irwin relationship. Note that there our two models for the stress intensity factor one for plane stress and plane strain.
 (Plane Strain)
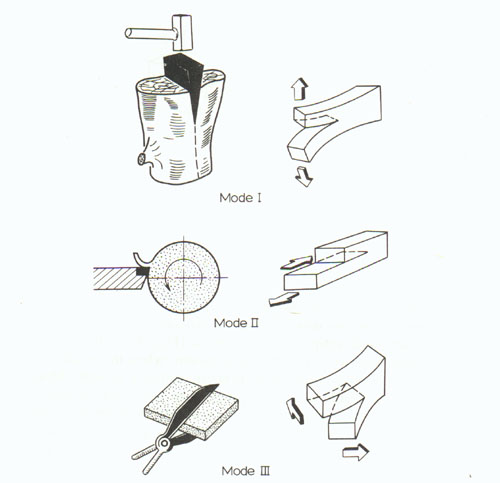
The total energy release rate in combined mode cracking can be obtained by adding the energies from the different modes (Figure 4.),
These models by Irwin started the foundation of linear elastic
fracture mechanics (LEFM). This discipline of fracture mechanics
characterizes the state of material loading over a volume of sufficient
size that the fracture strength of many engineering materials
can be given in terms of the critical (maximum) stress intensity
factor, KIC.
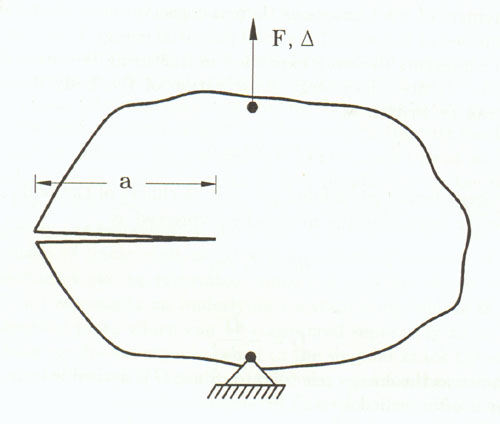
Shown in the figure is a cracked body with a force being exerted on it and the propagation of a crack (Figure 5.).

According to Clapyron's Theorem, the strain energy is:

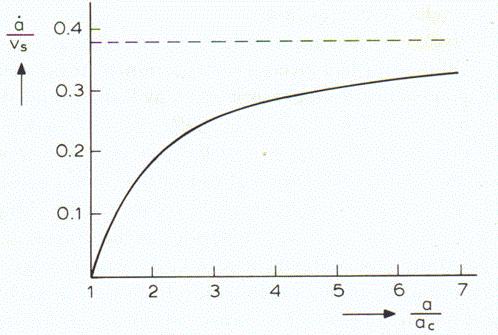
Crack Speed and Kinetic Energy
In the previous sections, we assumed that the crack growth was slow. Fracture instability occurs when the energy release rate G remains larger than the crack resistance. The surplus of energy is converted into kinetic energy which governs the speed at which the crack will propagate through the material. The total amount of energy that is converted into kinetic energy after a crack growth a.

The assumptions with the following model are:
Crack Growth using Energy Theorems
So far we have assumed that the crack resistive force is independent
of crack length. This is true only for crack under plain strain.
For plane stress, the crack resistance varies with amount of
crack growth. When a particular specimen is loaded, the crack
starts propagating, a further increase of the stress is required
to maintain crack growth, although the crack is longer it can
withstand a higher stress. During stable crack growth the energy
release rate is equal to the crack resistive force. As can be
seen in Figure 6. the growth rate of the crack increases with
an increase in crack size. For example in a ductile material
the energy required for crack growth is the same as the amount
of work for formation of a new plastic zone at the tip of the
advancing crack, plus the work required for initiation, growth
and coalescence of microvoids.
Fracture Energy of Specimen of Different Sizes
In a plastic, cylindrical test specimen deforms in a way that the degrees of deformation is nearly constant along the whole cross section. Research has shown that deformation of geometrically similar specimens of different diameters made from similar material is the same in any phase of the tensile test and not only the reductions of area but the contour lines in the vicinity of necking. The absolute value of the stress is independent of the size is the strain rate is constant.
A proportion law of L. Gillemot states that to the same deformation
of two geometrically similar specimens from similar material,
similar specific energy is necessary if the cross head speed is
proportional with the diameters of the specimen.

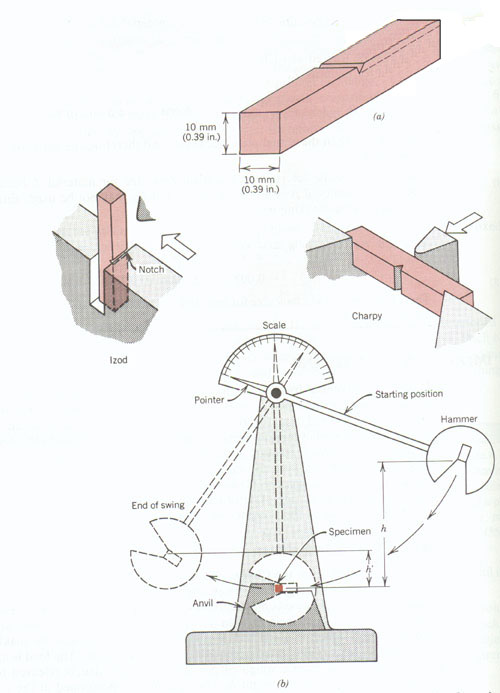
Impact Energy Testing Methods
In order to learn more about the complex nature of fracture in materials impact testing conditions were established. The conditions that were judged the most relative to the potential for fracture are:
With the Charpy V-notch (CVN) technique, the specimen is in the shape of a bar of square cross section with a V notch. The load is applied as an impact below from a weighted pendulum hammer that is released from a position h. The pendulum with a knife edge strikes and fractures the specimen at the notch. The pendulum continues its swing, rising to a maximum height h', which is lower than h. The energy necessary to fracture the test piece is directly calculated from the difference in initial and final heights of the swinging pendulum (Figure 7.). The impact energy (toughness) from the Charpy test is related to the area under the total stress-strain curve. The difference in the Charpy and the Izod techniques is in the way that the specimens are supported in the apparatus machine.
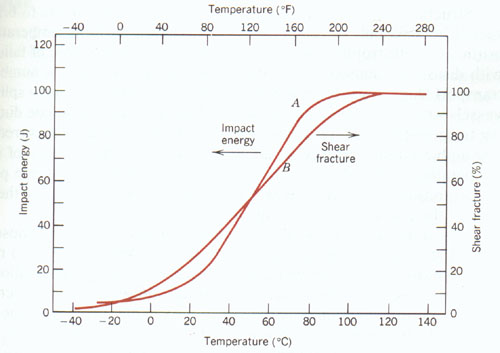
One can expect that materials with large values of strength and ductility to have large impact fracture energies. One has to also note that the impact data are very sensitive to test conditions such as temperature, specimen size, and notch configuration as can be seen in Figure 8.
References
For information relating to the example problem: http://www.lib.umich.edu/libhome/Dentistry.lib/Dental_tables/Surffreener.html
Submitted by Jireh J. Yue
Virginia Tech Materials Science and Engineering
http://www.sv.vt.edu/classes/MSE2094_NoteBook/97ClassProj/anal/yue/energy.html
Last updated: 5/4/97