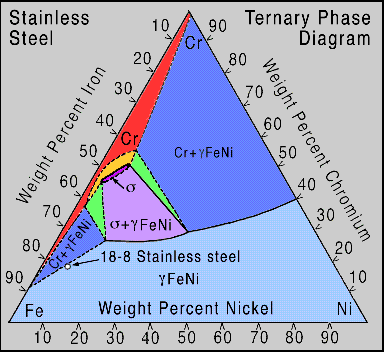
Phase Diagram Basics:
View in Frames:
Analytic,
Experimental,
Examples,
Visualization

Phase diagrams are maps of the equilibrium phases associated with various
combinations of temperature and composition. Binary phase diagrams are two
component maps widely used by engineers. They are helpful in predicting phase
transformations and the resulting microstructures. At Virginia Tech binary
phase diagrams are first studied in MSE 2034 and 2044, Introduction to
Materials Science and Engineering, and students continue to use these diagrams
in other courses. Because these diagrams are fundamentally important, "Phase
Diagram Basics" has been chosen as the topic for this years' 1996 MSE 2094
Team Class Project.: Team Picture
This paper is divided into four specific sections:
- The Analytical Methods and Basic Concepts section focuses on the equations and theory behind a phase diagram.
- The Experimental section explains the procedures used to develop and confirm a phase diagram by evaluating specific materials.
- The Examples and Applications section works through sample problems and shows how phase diagrams affect material selection with real world applications.
- The Scientific Visualization group brings this paper to life providing the pictures , movies, and interactive clickable maps. On their page you can work through a tutorial and learn how they created the images and movies for this project.
This project is intended to help students who are studying binary phase diagrams in MSE 2034 and 2044, Introduction to Material Science and Engineering, by providing additional information on phase diagrams. There are two ways to view this project: One way is to go through each page in the standard format and the other way is by utilizing frames. Frames requires an updated version of Netscape but provides you, our reader, a much more interactive experience such as a scrolling glossary and a list of sections. If you hit the back button on the netscape toolbar you will exit the frame format. You can remain in the frames format if you select "back in frame" with the mouse button.
A list of references is available as well as a list of similar web sites.
Materials Science & Engineering 2094, Spring 1996
Any comments and suggestions about the material presented above, please contact
James Myers at anon49@vt.edu and
R.D. Kriz at rkriz@vt.edu
Faculty Advisors:
Ronald D. Kriz: Instructor and Director of the Laboratory of Scientific Visual Analysis
Guo Quan Lu: Guest lecturer on "Thermodynamics of Phase Diagrams"
http://www.sv.vt.edu/classes/MSE2094_NoteBook/96ClassProj/proj.html
College of Engineering
Virginia Tech

