The total derivative of a scalar function of two independent variables (x,y) is the result of combining the idea of the vector gradient of the scalar function with an infinitesimal position vector. The position vector defines an infinitesimal distance that seperates two points, A and B, see Fig. 1 below. Both the gradient of the scalar function and the position vector coexist in the two dimensional x-y plane by definition as shown in Fig. 1. The total derivative is defined as the vector dot product of the position vector with the vector gradient of the scalar function, f(x,y). Hence the total derivative is a scalar quantity that exists in the x-y plane but is not envisioned in the x-y plane. The objective here is to envision the total derivative as a small change in the scalar function associated with the total derivative. It is common to envision the change in the scalar function as a curved surface above the x-y plane. However changes in the scalar function at discrete points within the x-y plane, which map out a curved surface, is not the same as the difference of the scalar function associated with the total derivative.
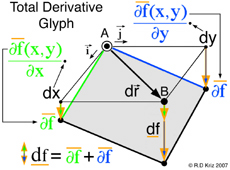
The idea encapsulated in the mathematical definition of the total derivative is that the scalar function changes some infinitesimal amount corresponding to the infinitesimal distance between points A and B, see Fig. 1. Therefore the total derivative, df(x,y), on the left side of the equation, shown above, does not contain the idea of a gradient but simply represents a small differential change of the scalar function. However on the right side of the equation the idea of the gradient is envisioned as green and blue sloped terms of a tangent plane multiplied by their respective dx and dy components of the position vector that defines the infinitesimal distance from point A to point B. Hence the differential change in f(x,y) is envisioned along the x and y axes as two orange vertical line segments that correspond to differential changes in the scalar function associated with the dx and dy components. As the postion vector rotates within the x-y plane from the x-axis (dy=0) to the y-axis (dx=0) the two vertical orange line lengths can be seen to change proportionally as the vector projections of dx and dy change.
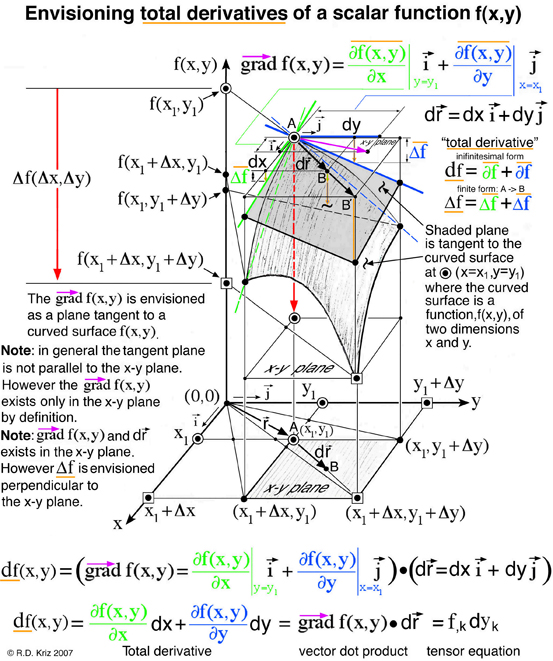
In Fig. 1 the graphical and analytic thinking coincide to create the graphical method. The total derivative can be envisioned as the sum of these two orange lines that extend downward from point B and intersect the tangent plane. Point B can be located anywhere in the x-y plane, but here point B is intentionally located such that dx < Δx and dy < Δy to emphasize the distance between points A and B is infinitesimally small. Unfortuanetnly only finite distances can be shown. If a different point B' is located at dx=Δx and dy=Δy another orange line is shown at x1+Δx and y1+Δy. For any point B the total derivative is envisioned as an orange line extending downward from point B in the x-y plane that intersects the tangent plane. In summary the change in the scalar function associated with the total derivative is envisioned as an orange vertical line and the change in the scalar function measured at discrete points is shown as a red vertical line. This difference is shown graphically in Fig. 1.
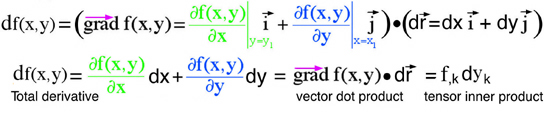
This vector dot product can also be mathematically defined as a tensor inner product using the economy of index notation, f,k dyk where the summation indice k is restricted to k=1,2. Here the simplicity of the tensor summation more closely connects to ideas in the graphical method which demonstrates a cognitve link between mathematical and graphical thinking using prior knowledge. If the reader has a mathematical grasp of gradients, total derivatives, infinitesimal position vectors, and tensor summation, combining these ideas is possible with a cognitive connection to the graphical method.
Sometimes graphical and mathematical methods coincide and enhance our understanding of complex ideas that can not always be explained with either just images or math. There is an interesting special case where the points A and B are confined to exist in a surface where the scalar function f(x,y) is constant. This would be seen as a family of planes parallel to the x-y plane intersecting the f(x,y) axis in Fig. 1. Of course for this special case it is easily seen by using the graphical method defined in Fig. 1 that the slopes of the gradient of f(x,y), highlighted as green and blue sloped lines, must be zero. It is obvious that if the infinitesimal position vector is confined to a surface where f(x,y) is constant, then a differential change of this function must be zero mathematically. However this trivial mathematical statement can also be seen in the graphical method above where the slopes of the gradient of f(x,y) must be zero. Many mathematical text books use this special case as an example where the both the vector gradient of f(x,y) and the infinitesimal position vector are nonzero and perpendicular (orthogonal) vectors. The graphical method reveals that for this special case the vector gradient of f(x,y) can not be nonzero. Perhaps this is a trival example but it does provide evidence that graphical methods can reveal information that goes beyond our understanding when using just the mathematical method.