1. Introduction
Ground Penetrating Radar (GPR) is a nondestructive technique increasingly
used in recent years for many applications, such us:
- Void and rebar mapping
- Pavement thickness evaluation
- Stratigraphic profiling
- Utility mapping and underground storage tank locating
The purpose of this document is to describe how GPR works, to
present some cases where GPR has been used successfully, and to
show how we can use scientific visualization to present the radar
output data.
2. GPR Theory
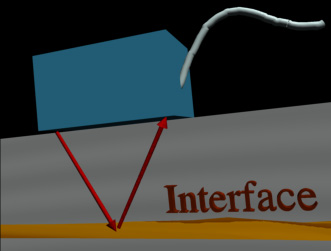
The principle of GPR consists on transmitting electromagnetic waves and receiving the reflected signals. Reflections occur at interfaces between different materials.
The propagation velocity is approximated by:
Thus if the relative dielectric constant is known, the depth of the reflective interface may be found from the measured return signal time.
2.1. GPR Concepts
GPR concepts may be explained as follows:
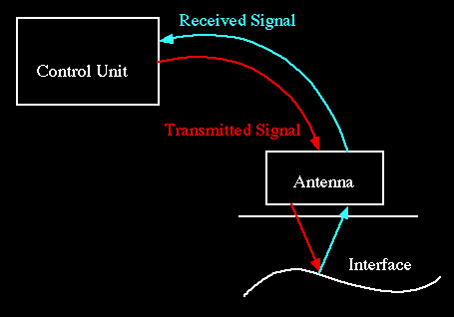
- A sequence of trigger pulses is generated in the control unit by the radar circuitry.
- The trigger pulses are sent through the control cable to the antenna.
- In the antenna, each trigger pulse is transformed into a bipolar transmit pulse.
- Energy is transmitted in a conical pattern into the subsurface.
- The transmitted pulses encounter different materials in the subsurface with different dielectric properties.
- In the interface, some energy is reflected back to the subsurface and detected by the antenna.
- The reflected signals are sent to the control unit.
- In the control unit, The signals are processed and displayed.
Two material properties that affect the GPR use are conductivity and relative dielectric permittivity.
2.2. Electrical Conductivity
Conductivity is a measure of the material ability to conduct electric current. It is expressed in Siemens/meter (S/M) or mho/m. Conductivity is considered as the material property which affects the signal attenuation that is conductivity controls the signal penetration. In fact, lower conductivity increases the signal penetration and higher conductivity makes the radar signal penetration difficult.
2.3. Relative Dielectric Permittivity
The relative dielectric constant is a measure of the capacity of a material to store a charge when an electric field is applied. It is dimensionless and is given by:
2.4. Reflection Strength
The reflection strength is given by:
 In GPR, this equation is simplified to:
The strength of the reflected signal is governed by the following conditions:
- if -0.2 < r < 0.2, we will have a weak response
- if -0.35 < r <-0.2 or 0.2 < r < 0.35, we will have a medium response
- if -1 < r < -0.35 or 0.35 < r ( 1, we will have a strong response
3. GPR Use and Data Visualization
The output data of the Radar is binary in format. A C-program was used to convert the file into ascii format where the data is stored in a 512 x (number of scans) matrix. 512 is the number of samples per scan along the depth. SpyGlass Transform was used to visualize the ascii file. The outcome display represents the distance along the subsurface in the X-axis, the depth in the Y-axis, and the intensity of the reflected signal in color.
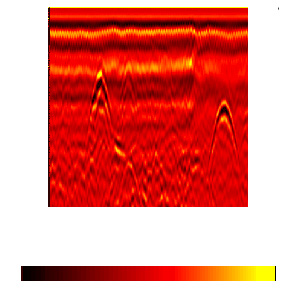
3.1. Detecting Voids
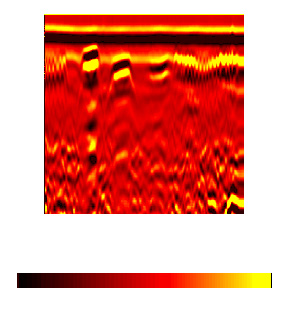
3 voids about 20 cm below an on grade concrete slab were detected using GPR. These voids have 2 in2 surface area and are, from left to right, 6 in, 3 in, and 1 in thick. A break of the wire mesh is also detected in the region where these voids are located.
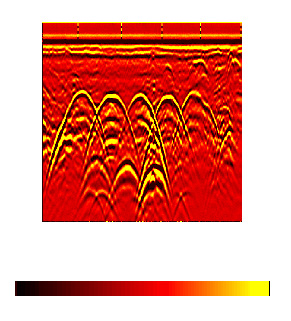
3.2. Locating Pipes
Two drain pipes beneath a concrete floor were detected by GPR. The "squigly" pattern in the top represents the reflected signals from the wire mesh. The first pipe is about 1 m beneath the surface and the second is 75 cm.
3.3. Locating Underground Storage Tanks
5 underground fuel storage tanks were detected by GPR. Total depth is about 1 m and the depth of the top of the tanks is 1 m.
C-program used for data conversion.
4. References
- Bungey J. H. and Millard S. G., "Radar Inspection of Structures", Engrs Structs & Bldgs, May 1993.
- GSSI Inc, Subsurface Interface Radar, North Salem, New hampshire
- Gerardo G. Clemena, Michael M. Sprinkel, and Robert R. Long, "Use of GPR for detecting voids under a jointed concrete pavement, Transportation Research Board, Washington D. C., 1987.
Posted May 26, 1996
URL: http://www.sv.vt.edu/class/Student_Proj/class96/loulizi/loulizi.html